Speaking and Writing - PTE Academic / UKVI, PTE Core

Describe Image

Describe Image gives you a chart, graph, map or picture, 25 seconds to look, and 40 seconds to talk. Content is now scored on a 0–6 scale by Pearson’s AI and a human reviewer, and the difference between a 4 and a 6 is whether you explain relationships or just read off numbers. Here is the structure that gets there in 40 seconds.

25 s
to prepare
40 s
to speak
5–6
items in Academic · 3–4 in Core
16
marks: Content 6, Fluency 5, Pronunciation 5

The task

Describe Image comes after Repeat Sentence. In PTE Academic the images are academic: bar and line charts, pie charts, tables, maps, process diagrams. In PTE Core they are everyday photographs and simple visuals.

Appears inPTE Academic / UKVI (charts, graphs, maps) and PTE Core (everyday images)
Items per testAcademic 5–6 · Core 3–4
Preparation time25 seconds
Time to speak40 seconds
ScoringPartial credit — Content 0–6 (Pearson: AI plus examiner review), Oral fluency 0–5, Pronunciation 0–5
Negative markingNone
Skills creditedSpeaking
In the exam
  1. The image appears with a 25-second countdown

    The image, its title and any axis labels are on screen from the first second. Nothing is recorded during the countdown. Use it to read the title, the axes and the biggest and smallest values.

  2. The microphone opens automatically

    When the countdown ends the status box shows “Recording” and a 40-second progress bar starts. Start within three seconds or the recorder closes on silence. The image stays on screen while you speak.

  3. You speak for up to 40 seconds

    The recording ends when the bar completes or when you stop for three seconds. Aim to finish your conclusion at around 35 seconds; running into the bar mid-sentence is fine, but a 20-second answer leaves half the available content unsaid.

  4. Five or six items in Academic, three or four in Core

    Each image is different in type, so a chart is followed by a map or a diagram. The same four-part structure works for all of them.

How one item is scored

Question

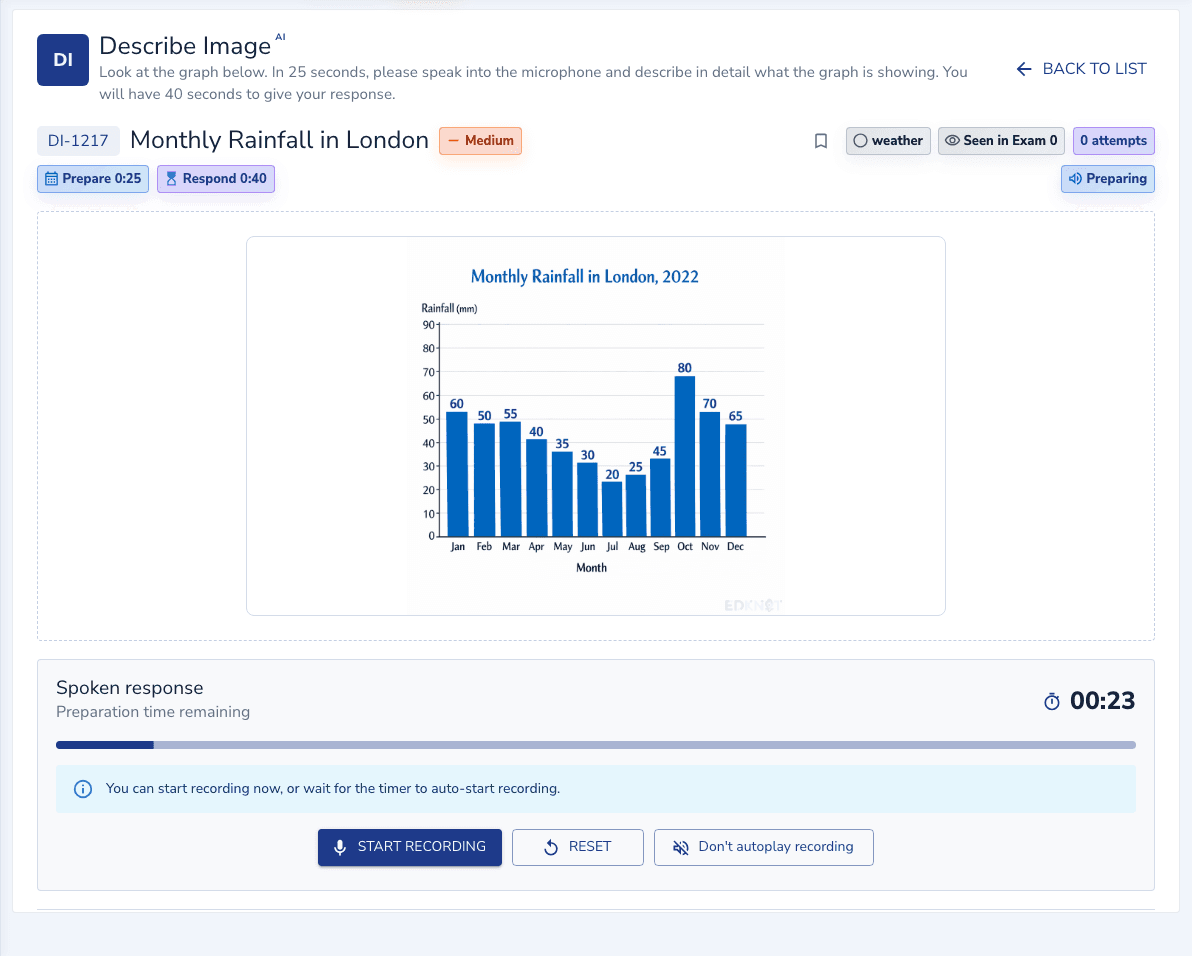
Describe the chart: “Monthly Rainfall in London, 2022” — a bar chart of rainfall in millimetres across the twelve months. (Real bank question — the chart is shown in the player below. 25 seconds to prepare, 40 seconds to speak.)

Answer

The following graph gives information about the monthly rainfall in London for the year 2022. The horizontal axis represents the months from January to December, and the vertical axis shows rainfall in millimeters. According to the graph, the highest rainfall occurred in October, at around 80 millimeters. The lowest rainfall was in July, at about 20 millimeters. Overall, rainfall is higher in the autumn and winter months and lower in the summer. In conclusion, the graph illustrates the seasonal variation in London’s rainfall.

Why it scores

It names the chart, both axes, the highest and lowest points, the overall trend, and closes with a conclusion — a complete 40-second structure.

What loses marks

“This graph shows rainfall. January is 55. February is 40. March is 35, April is 45, May is 50…” It reads values in order until the bar runs out, never says which month is highest or lowest, never mentions a season, and stops mid-list. Every number is right, but a listener cannot picture the shape of the year. That is a Content 3, and the pauses between values pull Oral fluency down with it.

How it is scored

Three traits with partial credit, all of it going to your Speaking score. Content is scored by Pearson’s AI and reviewed by a Pearson examiner in the live test, so it is judged on meaning, not on keyword matching.

Content: 0–6 for how completely a listener could picture the image

A 6 describes the image fully and accurately and explains the relationships between its features. A 5 covers the main features accurately and names some relationships without expanding on them. A 4 gives accurate simple descriptions but misses some main features. A 3 is superficial with minor inaccuracies. A list of points with no description is a 1. The test at every level is whether a listener could build a mental picture from what you said.
Oral fluency: 0–5 for continuous speech

The top bands need smooth rhythm with at most one hesitation, repetition or false start. Pausing to find a number, or restarting a sentence because the value was wrong, is what drops fluency on this task. A slightly wrong number said fluently costs less than the right number after a two-second search.

Pronunciation: 0–5 for clarity

Numbers, years and units are the words that go wrong here: “fifteen” and “fifty”, “thousand” and “hundred”. Say them slowly and stress them, because a misheard number is a Content inaccuracy as well.

The Content descriptors reward relationships: which is highest, how it changed, what that suggests. Reading every label off the chart earns a 3 or 4. Two comparisons and a conclusion earn the 5 and 6. PTE Core scores Content on a 0–5 scale with the same logic: all key elements, their relationships, and a conclusion or implication for the top band. That review is part of Pearson’s live test. EdKnot practice scoring is entirely automated: no person sees or scores any practice response.

Templates that score full marks

Every template below is taught inside EdKnot and verified against the same AI scoring engine that marks your practice — out of 16 for this task.

Template 1 — highest/lowest comparison
This [CHART TYPE] illustrates [TOPIC] across [CATEGORIES OR PERIOD]. [A] is highest at [VALUE], while [B] is lowest at [VALUE], a difference of [GAP]. Overall, the chart shows [TREND OR INSIGHT].
Template 2 — key feature walk
The given [CHART TYPE] represents [TOPIC]. The most important feature is [FEATURE] at [VALUE], whereas the lowest is [FEATURE] at [VALUE]. Similarly, it can be seen that [ANOTHER REAL OBSERVATION]. In conclusion, the chart shows [SUMMARY INSIGHT].
Template 3 — prominent observation
The image is a [CHART TYPE] illustrating [TOPIC]. The most prominent feature is [TREND OR VALUE]. Another significant observation is [SECOND VALUE OR COMPARISON]. Overall, the image shows [KEY INSIGHT].

How to answer it

The 25 seconds are for finding four things: what the image is, the extremes, one relationship, and a conclusion. The 40 seconds are for saying them in that order.

  1. Seconds 1–5: read the title and the axes

    Say to yourself what the image measures, in what units, over what range. This becomes your first sentence and it is the one sentence you can plan word for word.

  2. Seconds 5–15: find the highest, the lowest and one comparison

    Circle the extremes with your eyes and note their values. Then find one relationship: a trend across time, a gap between two categories, or a stage that leads to another. That relationship is what separates a 4 from a 5.

  3. Seconds 15–25: decide the conclusion

    One sentence about what the pattern suggests: rainfall peaks in autumn, the older group spends more, the process has three stages. Having it ready means you never run out of things to say and never end mid-list.

  4. Speak in four moves

    Introduce the image. State the extremes with their values. Give the comparison or trend. Close with the conclusion. EdKnot’s Describe Image templates lay out these moves with slots to fill, so the structure becomes automatic.

  5. If a value is unclear, approximate and move on

    “Around 80 millimetres” is fine. Stopping to be exact costs a hesitation and often a restart, and Pearson’s human reviewer is judging whether the picture is accurate, not whether it is exact to the unit.

Common mistakes

MistakeWhy it costs marksWhat to do instead
Reading every value off the chartWhy it costs marksThe Content descriptors for 5 and 6 require relationships between features. A complete list with no comparison sits at 3 or 4.What to do insteadTwo extremes, one relationship, one conclusion. Leave the middle values out.
Stopping to find the exact numberWhy it costs marksEach search is a hesitation against Oral fluency, and the number rarely changes the Content score.What to do insteadApproximate with “about” or “roughly” and keep speaking.
Finishing at 20 secondsWhy it costs marksHalf the time unused means the relationship and conclusion were never said, and those are the marks between 4 and 6.What to do insteadPlan the conclusion during preparation so you always have a closing sentence to reach.
Describing what the image is about instead of what it showsWhy it costs marksGeneral statements about the topic are not descriptions of the image. A listener could not picture it, which is the test at every Content level.What to do insteadEvery sentence after the first should contain a feature of the image: a value, a label, a position, a stage.
Memorised template with empty slotsWhy it costs marksPearson’s human reviewers see “the highest value is [pause] and the lowest value is [pause]” as a 1 or 2: a list without description.What to do insteadUse the template as the order of moves, and fill each slot with a real feature before you start speaking.
Ignoring the title and unitsWhy it costs marksWithout them the description is ambiguous: “it rose to 80” could be anything. Accuracy at Content 5 and 6 includes what is being measured.What to do insteadFirst sentence: what the image shows, in what units, over what period or categories.

How to practise

Describe Image improves fastest when you practise the structure on many image types rather than perfecting one chart. Ten images in a session, each once, with review, is the right shape.

  1. Rotate image types deliberately

    Bar chart, line graph, pie chart, table, map, process diagram, photograph. Each has its own vocabulary for the “relationship” move: trend, share, difference, stage, location. Practise them in turn until none is a surprise.

  2. Record once, under the real timers

    25 seconds of preparation, 40 to speak, one take. If you find yourself wanting a second attempt, that is the signal to review, not to re-record.

  3. Check Content against the four moves

    Did you name the image? Give the extremes with values? State a relationship? Conclude? Missing any one of them is the difference between bands. EdKnot’s review shows your transcript beside the official trait scores, so tick the four moves off against it yourself.

  4. Count the pauses

    Play the recording back and count every hesitation and restart. More than one means the structure is not automatic yet. Say the same image again with the template in front of you and see whether the count drops.

  5. Build a numbers habit

    Read out chart values from any news article at a slow, stressed pace for two minutes a day. Clear numbers protect both Content and Pronunciation.

Practice set

12 images with answers

Items from the EdKnot bank, each with its answer, on one page. Every item opens in the practice player with its timer, recording and scoring.

Describe Image practice inside the EdKnot question player

What 65 and 79 need

Describe Image is scored per item and combined with the other speaking tasks. These are the typical profiles behind each level on this task.

65

The image is named, the extremes are stated with roughly correct values, and one trend or comparison is mentioned. There may be a couple of hesitations and the conclusion may be thin. Content around 4, fluency in the Good band.

79

All four moves in 35–40 seconds, with a specific relationship (a trend with its direction and size, or a comparison between named categories) and a conclusion that follows from it. At most one hesitation and clear, stressed numbers. Content 5 or better, fluency Advanced.

Frequently asked questions

How much time do you get for Describe Image in PTE?

You get 25 seconds to study the image and 40 seconds to speak. The timing is the same in PTE Academic and PTE Core.

How many Describe Image questions are there in PTE?

PTE Academic has 5–6 items using charts, graphs, tables, maps and diagrams; PTE Core has 3–4 items using everyday images.

How is Describe Image scored in PTE?

Content is scored 0–6 on how fully and accurately a listener could picture the image from your description, including the relationships between its features. Oral fluency and Pronunciation are each scored 0–5. Content is scored by Pearson’s AI and reviewed by a Pearson examiner in the live test.

Do I need to mention every number in Describe Image?

No. Listing values without describing relationships between them earns a Content score of 3 or 4. The top bands need the main features, the relationships between them, and a conclusion.

Is Describe Image different in PTE Core?

The timing is the same, 25 seconds of preparation and 40 seconds to answer, but Core uses everyday images rather than academic charts, has 3–4 items instead of Academic’s 5–6, and scores Content on a 0–5 scale rather than 0–6.

Do Describe Image templates work?

Templates help with the order of moves, and they are the fastest way to stop running out of things to say. They hurt when the slots are left vague: Pearson’s human reviewer scores a list of empty phrases as a 1 or 2. Fill every slot with a real feature of the image.

The main features, the relationships between them, and one conclusion, without pauses.

Practise Describe Image with the real clock and see the answer the moment you submit.

Practise Describe Image